Financial highlights
The following selected financial data should be read in conjunction with the consolidated financial statements and notes thereto included in Item 8 of our form 10-K. The Statement of Operations, Statement of Financial Position and other data have been derived from our audited financial statements. Certain prior period information has been reclassified to conform to the current year presentation and to reflect the results of the divested Rollmet business as a discontinued operation.
| Years Ended September 30 | ||||||||||
(dollars in millions, except per share amounts) |
2012(a) |
2011(b) |
2010(c) |
2009(d) |
2008(e) |
|||||
Statement of Operations Data: |
||||||||||
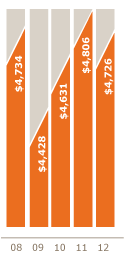
Sales |
$ |
4,726 |
$ |
4,806 |
$ |
4,631 |
$ |
4,428 |
$ |
4,734 |
Cost of sales |
3,324 |
3,427 |
3,353 |
3,118 |
3,308 |
|||||
Selling, general and administrative expenses |
543 |
533 |
476 |
457 |
484 |
|||||
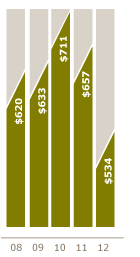
Income from continuing operations |
609 |
615 |
557 |
589 |
673 |
|||||
Income from discontinued operations, net of taxes |
— |
19 |
4 |
5 |
5 |
|||||
Net income |
609 |
634 |
561 |
594 |
678 |
|||||
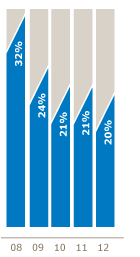
Net income as a percent of sales |
12.9% |
13.2% |
12.1% |
13.4% |
14.3% |
|||||
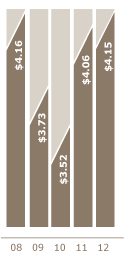
Diluted earnings per share from continuing operations |
4.15 |
3.94 |
3.50 |
3.70 |
4.13 |
|||||
Statement of Financial Position Data: |
||||||||||
Working capital(f) |
$ |
1,347 |
$ |
1,394 |
$ |
1,237 |
$ |
1,003 |
$ |
598 |
Property |
773 |
754 |
707 |
719 |
680 |
|||||
Goodwill and intangible assets |
1,071 | 1,088 | 1,072 | 964 | 807 | |||||
Total assets |
5,314 |
5,389 |
5,064 |
4,645 |
4,144 |
|||||
Short-term debt |
— |
— |
24 |
— |
287 |
|||||
Long-term debt |
779 |
528 |
525 |
532 |
228 |
|||||
Shareowners' equity |
1,259 |
1,523 |
1,482 |
1,292 |
1,408 |
|||||
Other Data: |
||||||||||
Capital expenditures |
$ |
138 |
$ |
152 |
$ |
109 |
$ |
153 |
$ |
171 |
Depreciation and amortization |
174 |
159 |
167 |
151 |
138 |
|||||
Dividends per share |
1.08 |
0.96 |
0.96 |
0.96 |
0.80 |
|||||
Stock Price: |
||||||||||
High |
$ |
61.46 |
$ |
67.29 |
$ |
68.04 |
$ |
51.37 |
$ |
76.00 |
Low |
46.37 |
43.82 |
47.19 |
27.67 |
43.26 |
|||||
(a) Net income includes $38 million of net restructuring and asset impairment charges ($58 million before income taxes), primarily related to employee severance costs and certain customer bankruptcy charges. Approximately $38 million of the pre-tax charge was recorded in cost of sales, $25 million was included within selling, general and administrative expenses, and $5 million was classified as a gain within Other income. Net income also includes a $19 million income tax benefit related to the favorable resolution of certain tax matters in 2012.
(b) Income from discontinued operations includes a $17 million gain ($27 million before income taxes) resulting from the sale of the Rollmet business. In addition, income from continuing operations includes $17 million of restructuring and asset impairment charges ($27 million before income taxes), primarily related to real estate lease and contract termination charges, asset impairment charges and employee severance costs. $26 million of the pre-tax restructuring and asset impairment charge was recorded in cost of sales and the remaining $1 million was included in selling, general and administrative expenses. Net income also includes a $16 million income tax benefit related to the retroactive reinstatement of the previously expired Federal Research and Development Tax Credit.
(c) Includes a $20 million income tax benefit related to the favorable resolution of certain tax matters in 2010.
(d) Includes $21 million of restructuring and asset impairment charges, primarily related to reductions in workforce and decisions to implement certain facility rationalization actions ($14 million after taxes). Of the total restructuring and asset impairment charge, $19 million was recorded in cost of sales and the remaining $2 million was included in selling, general and administrative expenses.
(e) Includes a $22 million income tax benefit related to the favorable resolution of certain tax matters.
(f) Working capital consists of all current assets and liabilities, including cash and short-term debt.