The following selected financial data should be read in conjunction with the consolidated financial statements and notes thereto included elsewhere in our Annual Report on Form 10-K. The Statement of Operations, Statement of Financial Position and other data have been derived from our audited financial statements. Certain prior period information has been reclassified to conform to the current year presentation and to reflect the results of the divested Rollmet business as a discontinued operation.
Click here to download the 2011 10-K Form
Years Ended September 30
|
||||||||||
| (dollars in millions, except per share amounts) | 2011(a) |
2010(b) |
2009(c) |
2008(d) |
2007(e) |
|||||
| Statement of Operations Data: | ||||||||||
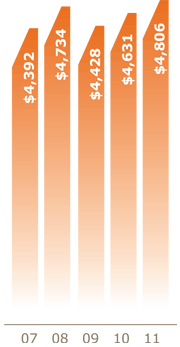
| Sales | $ |
4,806 |
$ |
4,631 |
$ |
4,428 |
$ |
4,734 |
$ |
4,392 |
| Cost of sales | 3,427 |
3,353 |
3,118 |
3,308 |
3,073 |
|||||
| Selling, general and administrative expenses | 533 |
476 |
457 |
484 |
481 |
|||||
| Income from continuing operations | 615 |
557 |
589 |
673 |
583 |
|||||
| Income from discontinued operations, net of taxes | 19 |
4 |
5 |
5 |
2 |
|||||
| Net income | 634 |
561 |
594 |
678 |
585 |
|||||
| Net income as a percent of sales | 13.2% |
12.1% |
13.4% |
14.3% |
13.3% |
|||||
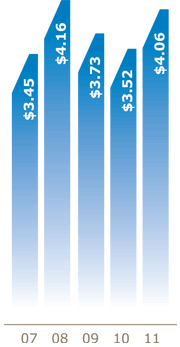
Diluted earnings per share from continuing operations |
3.94 |
3.50 |
3.70 |
4.13 |
3.44 |
|||||
| Statement of Financial Position Data: | ||||||||||
| Working capital(f) | $ |
1,394 |
$ |
1,237 |
$ |
1,003 |
$ |
598 |
$ |
710 |
| Property | 754 |
707 |
719 |
680 |
607 |
|||||
| Goodwill and intangible assets | 1,088 |
1,072 |
964 |
807 |
691 |
|||||
| Total assets | 5,389 |
5,064 |
4,645 |
4,144 |
3,750 |
|||||
| Short-term debt | — |
24 |
— |
287 |
— |
|||||
| Long-term debt | 528 |
525 |
532 |
228 |
223 |
|||||
| Shareowners' equity | 1,523 |
1,482 |
1,292 |
1,408 |
1,573 |
|||||
| Other Data: | ||||||||||
| Capital expenditures | $ |
152 |
$ |
109 |
$ |
153 |
$ |
171 |
$ |
125 |
| Depreciation and amortization | 141 |
149 |
144 |
129 |
118 |
|||||
| Dividends per share | 0.96 |
0.96 |
0.96 |
0.80 |
0.64 |
|||||
| Stock Price: | ||||||||||
| High | $ |
67.29 |
$ |
68.04 |
$ |
51.37 |
$ |
76.00 |
$ |
74.69 |
| Low | 43.82 |
47.19 |
27.67 |
43.26 |
54.38 |
|||||
(a) Income from discontinued operations includes a $17 million gain ($27 million before income taxes) resulting from the sale of the Company's Rollmet business. In addition, income from continuing operations includes $17 million of restructuring and asset impairment charges ($27 million before income taxes) primarily related to real estate lease and contract termination charges, asset impairment charges and employee severance costs. $26 million of the pre-tax restructuring and asset impairment charge was recorded in cost of sales and the remaining $1 million was included in selling, general and administrative expenses. Net income also includes a $16 million income tax benefit related to the retroactive reinstatement of the previously expired Federal Research and Development Tax Credit.
(b) Includes a $20 million income tax benefit related to the favorable resolution of certain tax matters in 2010.
(c) Includes $21 million of restructuring and asset impairment charges primarily related to reductions in workforce and decisions to implement certain facility rationalization actions ($14 million after taxes). $19 million of the restructuring and asset impairment charge was recorded in cost of sales and the remaining $2 million was included in selling, general and administrative expenses.
(d) Includes a $22 million income tax benefit related to the favorable resolution of certain tax matters in 2008.
(e) Includes (i) a $13 million reduction in income tax expense related to the retroactive reinstatement of the previously expired Federal Research and Development Tax Credit and (ii) a $5 million favorable adjustment to a previously recorded restructuring charge. The $5 million adjustment in 2007 was primarily due to lower than expected employee separation costs ($3 million gain after taxes).
(f) Working capital consists of all current assets and liabilities, including cash and short-term debt.
Sales(a)
($ in millions)
Earnings per Share
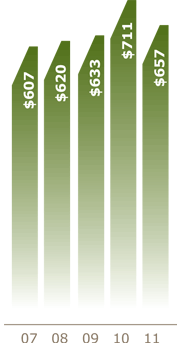
Cash Provided by
Operating Activities
($ in millions)
Return on Invested Capital(a)(b)
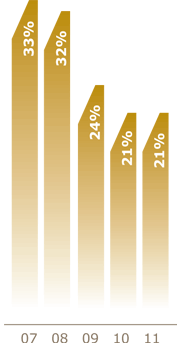

(a) Certain prior period information has been reclassified to conform to the current year presentation and to reflect the results of the divested Rollmet business as a discontinued operation.
(b) The Company calculates return on invested capital (ROIC) as net income from continuing operations excluding after-tax interest expense, divided by the average of invested capital at the beginning and end of the fiscal year. Invested capital is calculated as the sum of total shareowners' equity (excluding defined benefit accounting adjustments impacting accumulated other comprehensive loss) and total debt, less cash and cash equivalents.
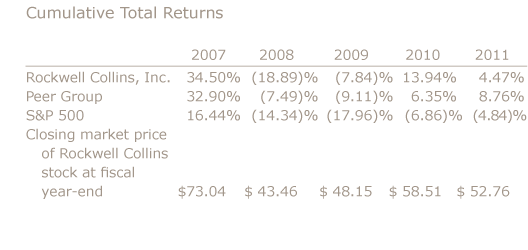
(c) The cumulative total return table and adjacent line graph compare the cumulative total shareowner return on the Company's Common Stock against the cumulative total return of the S&P 500 — Aerospace and Defense Index (Peer Group) and the S&P 500 — Composite Stock Index (S&P 500) for the five-year period ended September 30, 2011, in each case a fixed investment of $100 at the respective closing prices on September 29, 2006, and reinvestment of all cash dividends.
Safe Harbor Statement:
This Annual Report contains statements, including certain projections and business trends, that are forward-looking statements as defined in the Private Securities Litigation Reform Act of 1995. Actual results may differ materially from those projected as a result of certain risks and uncertainties, including but not limited to those detailed herein, in our Form 10-K and from time to time in our other Securities and Exchange Commission filings. These forward-looking statements are made only as of the date hereof.