Our performance demonstrates the "staying power" inherent in the company's shared services business model and the balanced focus on our Government and Commercial Systems businesses. It is also a testament to the leadership of the company and the hard work of all Rockwell Collins employees.
For 2007, sales increased 14% to $4.415 billion, earnings per share grew 26%, and we delivered operating cash flow of $607 million, 104% of net income, adding another year to a history of consistently outstanding financial performance.
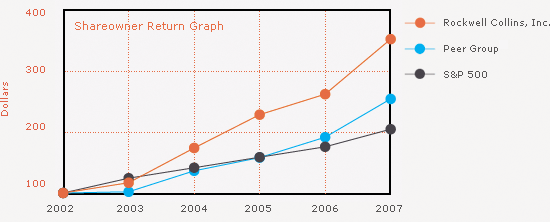
Over the last five years, our revenues have grown at an average annual rate of 12%, we have converted an average of 126% of our profit after tax into operating cash flow, and return on invested capital has improved each year since 2002, coming in at 33% in 2007. In addition, since 2002 earnings per share has increased 170%, an average annual rate of 22%. Ultimately, this performance has resulted in significant value for our shareowners. Over the past five years, we delivered an aggregate total return to shareowners in excess of 250%.
Certainly the robust market conditions in the Commercial and Government segments contributed to our ability to deliver these results. In Commercial Systems, delivery rates across the entire range of aircraft, from light business jets through large air transport platforms, continue to hold strong. We are capitalizing on these opportunities by extending our market reach and earning additional market share through new aircraft wins.
This year, we introduced Pro Line Fusion™, the next-generation avionics system for business and regional jets. This new offering extends our product set, expands market reach and allows us to further strengthen an already solid position in this market segment. Our launch customer for this new system, Bombardier Aerospace, will be equipping its Global family of aircraft with Pro Line Fusion.

| Cumulative Total Returns | ||||||
|---|---|---|---|---|---|---|
| 2002 | 2003 | 2004 | 2005 | 2006 | 2007 | |
| Rockwell Collins, Inc. | 100.00 | 116.95 | 174.21 | 229.10 | 262.87 | 353.57 |
| Peer Group | 100.00 | 102.03 | 136.54 | 158.36 | 191.93 | 255.06 |
| S&P 500 | 100.00 | 124.40 | 141.64 | 158.99 | 176.16 | 205.13 |
**The cumulative total return table and adjacent line graph compare the cumulative total shareowner return on the Company's Common Stock against the cumulative total return of the S&P 500 — Aerospace and Defense Index (Peer Group) and the S&P 500 — Composite Stock Index (S&P 500) for the five-year period ended September 30, 2007, assuming in each case a fixed investment of $100 at the respective closing prices on September 30, 2002, and reinvestment of all cash dividends.
