We're living through historic times. It's also a time of momentous change, uncertainty and doubt. And it's a time when the need for building trust has never been greater.
In fiscal year 2008, the 20,000 people of Rockwell Collins continued to build trust through countless acts of responsiveness, innovation, and delivering on commitments. The result was another year of outstanding financial performance. Revenue increased 8% to $4.77 billion and earnings per share improved 21% to $4.16 — our fourth consecutive year of EPS growth in excess of 20%.
Once again, the balance between our commercial and government businesses served us very well. Commercial Systems sales grew 10% and their operating margins increased 110 basis points to 23.3%. Government Systems sales grew 6% and operating margins improved to 20.5%, up 70 basis points over the previous year — an outstanding performance for any government business.
Unfortunately — as pleased as I am about our company's financial and strategic performance in fiscal year 2008 — I am very disappointed that macro-economic factors impacting markets worldwide have resulted in a loss of shareowner value.
As daily headlines in the United States portrayed a deepening financial crisis, and as economic weakness — and even panic — in America spread around the world, we all witnessed a global meltdown in equity markets.
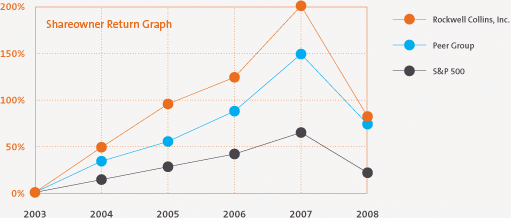
As a result, there was a great discontinuity between Rockwell Collins' operating performance — which was excellent in our view — and the equity markets, which performed poorly.

| Cumulative Total Returns | |||||
|---|---|---|---|---|---|
| 2004 | 2005 | 2006 | 2007 | 2008 | |
| Rockwell Collins, Inc. | 48.96% | 95.90% | 124.77% | 202.32% | 82.30% |
| Peer Group | 33.82% | 55.21% | 88.10% | 149.99% | 74.01% |
| S&P 500 | 13.86% | 27.81% | 41.61% | 64.90% | 21.30% |
| Closing market price of Rockwell Collins stock at fiscal year end |
$37.14 | $48.32 | $54.84 | $73.04 | $43.46 |
**The cumulative total return table and adjacent line graph compare the cumulative total shareowner return on the corporation's Common Stock against the cumulative total return of the S&P 500 — Aerospace and Defense Index (Peer Group) and the S&P 500 — Composite Stock Index (S&P 500) for the five-year period ended October 3, 2008, in each case a fixed investment of $100 at the respective closing prices on September 30, 2003, and reinvestment of all cash dividends.
